Blueprints for BEAD is a series of short notes and analysis on nuances of BEAD that might otherwise get lost in the volume of material published on this federal funding program. Click the “Blueprints for BEAD” tag at the bottom of this story for other posts.
There are still almost two dozen states that have yet to go through the Broadband Equity, Access, and Deployment (BEAD) program challenge process, which will lock down those locations that will be eligible for federal broadband infrastructure funding. And one refrain we’ve heard over and over from those in states that have already completed theirs is that, despite NTIA’s best efforts, it's complicated and hard.
States have been given significant leeway in setting the rules for developing a challenge process wherein unserved and underserved locations can be identified. Lacking clear direction from the NTIA for what may seem like insignificant details, the often-hastily developed rules have in many states resulted in opaque processes characterized by a lack of clear communication and outreach. The resulting state guidance on how to request a data license, navigate a challenge portal, and submit challenges has left many local governments, small ISPs, Tribes, and nonprofits feeling defeated about their ability to participate. Without the detailed counsel on strategies for identifying prospective challenges, the scale of impact that this group of eligible entities could have on BEAD outcomes has been significantly narrowed.
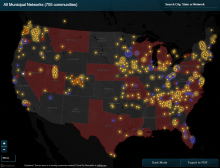
This is particularly troubling because widening the circle of those who can effectively participate is important. Residents, local governments, and nonprofits often have the best sense of exactly where the connectivity gaps in their communities exist. They also know what form the digital divide takes - whether in reliability, or cost, or latency, or available speeds. But so far, the challenge process for BEAD has been dominated by the largest ISPs that have the staff and expertise to interact with large amounts of geographic data in a relatively short period of time.